By Kristofer Ågren, Head of Business Intelligence and Data Analytics at Tele2 Sweden
The value of potential insights from big data is well-advertised by now. However, so is the complexity of the process and the difficulties that organisations face in integrating those insights into their operations. Is big data for everyone and what challenges must organisations overcome to make us of it?
According to Kristofer Ågren, Head of Business Intelligence and Data Analytics at Tele2 Sweden, machine learning and streaming analytics have become increasingly commoditized, which means that even people without a PhD in data science can make use of those methods. ‘Even as little as 5 years back, machine learning absolutely required a certain depth of understanding of the algorithms you were employing. In contrast, now several platforms have developed more intuitive tools for using machine learning methods, and more people are free to experiment. This requires a certain amount of wariness regarding validity issues, but is also tremendously exciting,’ says Ågren.
‘For Tele2, the main challenge is to stay relevant throughout the customer journey. With a number of data points that we collect regarding our customers, we are well positioned to use big data to understand our clients and keep them satisfied. However, all insights are not created equal.’
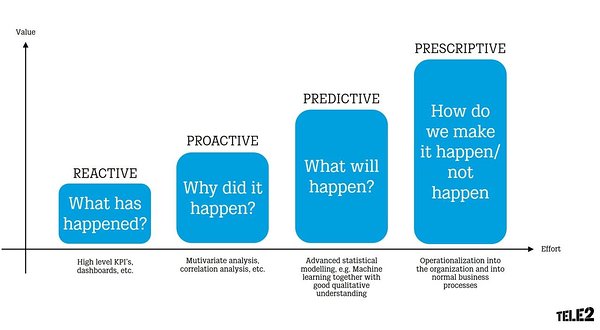
Below, you can see what Ågren describes as the four levels of organizational data use.
Graph: How to make use of data
Let’s say you’re a salesman who deals in fresh fruit. A fruit salesman. You keep track of your sales, and one week you notice that banana sales have suddenly dropped 50%. You realize that something has happened but cannot clarify anything else. You attempt to blindly correct any mistakes in the supply chain that may have had an effect. This is an example of the reactive use of data.
Next, say you have thousands of fruit-loving customers, so you periodically send out a feedback questionnaire regarding their satisfaction with your fruit-related services. When banana sales drop, you consult the latest feedback results and see that customers are rating your banana prices to be too expensive. This could be an indication that a cheaper competitor has appeared, so you lower your prices. After a few weeks, sales normalize. You proactively used the data to identify a proximal cause and made a business decision based on it.
For our intents and purposes, let’s suppose once more that you’re a fruit salesman with a knack for statistical analysis, with years’ worth of customer satisfaction and sales data. You combine machine learning with your years of insight to build a statistical model that predicts a good amount of the variance in sales caused by fluctuating banana prices. For example, you can tell that when the price of your bananas goes up 0.50€, over the next two weeks banana sales will drop 50%, assuming no changes in the quality of bananas or competitors’ pricing. You can predict sales based off of observable changes.
The last step to prescriptive data use in our little framework has less to do with statistical advancements and more with integrating data-based insights into the organisation as a whole. You may know, for example, that price, quality of fruit, and the availability of fruit are all major factors that contribute to steady sales. It is another step, however, to use that insight to manage supply chain relationships, especially assuming you have limited resources and must make decisions to invest in some areas and not others. What’s more important, and in which circumstances? How to make sure that your employees also understand and use these insights?
The takeaway here isn’t that you need perfect information for every business decision – that’s extremely unlikely. It’s that the more an enterprise can move from reactive towards prescriptive data-based decision making, the more effective it will be as an organization and the happier it can keep its customers.
While the methodology may be commoditizing, each step up requires a notable increase in the data and effort used, but, according to Ågren, it is well worth it.
‘The data analytics and insights vision of Tele2 is that all business decisions are supported by the analysis and understanding of data, driven by a culture passionate about data-driven decision making. While we are not there yet, it’s critical to our purpose of keeping our customers connected and satisfied.’
The Garage48 Baltic Open & Big Data 2017 hackathon is an important way for Tele2 to show our appreciation for data-driven decision making, and to continue fostering that culture inside our organization. We’re co-organising the event and contributing EXCLUSIVE DATA (with the necessary safety and privacy precautions taken, of course) to participants, and we’re very excited to see what is created on the 19th to 21st of May!
SIGN UP FOR THE FREE PRE-EVENT HAPPENING ON MAY 10TH
REGISTER FOR THE HACKATHON HERE

